Creating summary statistic tables
Sample script file: SummaryStatisticTables.mrs
This example script is based on the Museum sample data set. See
Running the sample table scripts.
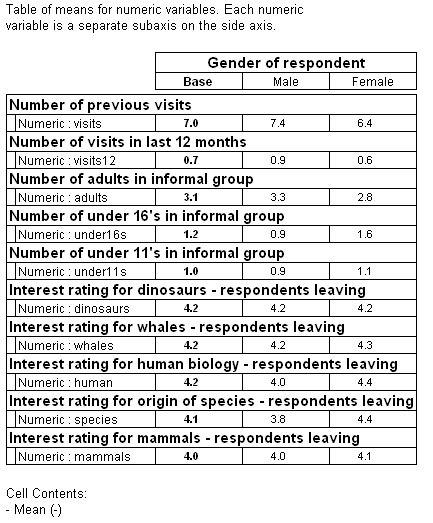
You can create tables containing just the summary statistics of numeric variables. This example creates a table that summarizes a number of different numeric variables including number of visits, number of visits in the last 12 months, and so on. Each row in the side axis of the table contains the mean of a different numeric variable. This is tabulated by gender on the top axis.
The table contains a single cell item, a mean. The following script specifies the cell item:
CellItems.AddNew(itMean, 1, "-")
The "-" parameter indicates that the mean is calculated, not for a fixed variable, but for the numeric variable specified by the numeric element in each row. The elements are defined in the axis expression, for example:
.AddNew("Table1", "!
visits{base() [IsHidden=True], numeric(visits)} +
visits12{base() [IsHidden=True], numeric(visits12)} +
...!"
An example of a table created using this method, with the individual numeric variables displayed as subaxes of the side axis, is shown below:
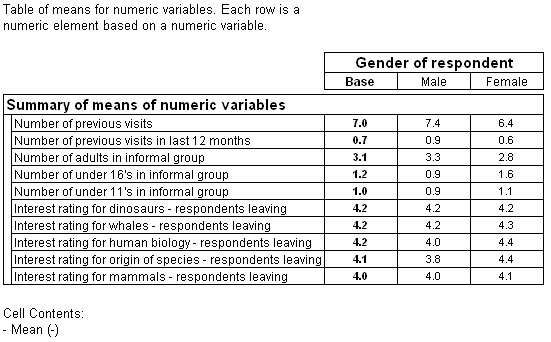
Alternatively, you can group all the variables into a single axis variable using the axis({}) syntax:
.AddNew("Table2", "!
axis({base() [IsHidden=true],
visits 'Number of previous visits' numeric (visits),
visits12 'Number of previous visits in last 12 months' numeric (visits12),
...
mammals 'Interest rating for mammals - respondents leaving'
numeric (mammals)
}) as SummaryVariable 'Summary of means of numeric variables'
* gender
!", "Table of means for numeric variables. Each row is a numeric
element based on a numeric variable.")
An example of a table created using this method is shown below:
In cells not corresponding to a row or column defined by a numeric element type (for example, the base row or column), values for the summary statistics are shown as zero or 1, depending on the statistic type. For example, means are shown as 1 and standard deviation and standard error are shown as zero.
Counts in a row or column defined by a numeric element are counts of the variable associated with the numeric element.
This example shows how to create a mean summary table. You can produce other types of summary statistic tables for any cell item that can be based on a numeric variable, for example, maximum, minimum, and standard deviation. for more information, see CellItem.Variable in
Table Object Model reference.
Note The column means test cannot be run against the mean statistic in a summary statistic table. It can only be run against the mean element (instead of mean cell item).
See also


